 English


325 S Biscayne Blvd #3524
Miami FL 33131
$500,000
Affordability
Monthly Mortgage for Unit 3524
$500,000$100,000 20%
30 Year Fixed at 6.75% Adjust
$2,570/month
Property Description
Beautiful 1bdrm/1bth condo with direct views of Biscayne Bay and Miami Skyline. Condo w/ Italian wood kitchen cabinets, granite counter-tops and stainless steel appliances along with marble counter-top bath and walk-in closet. Bldg amenities incl: 2 swimming pools, Jacuzzi, Sauna, 2 Fitness Centers, 2 Party Rooms, Convenience Store, and 24 hrs concierge, security, and valet. Centrally located within walking distance to Arena, Performance Center, Brickell Village and minutes to SoBe, KB, Grove, Gables, Design District, Wynwood and Airport. Sales office in bldg.
Property Details
- Unit #
- 3524 (floorplan)
- Bedrooms
- 1
- Bathrooms
- 1
- Maintenance Fee
- $777/mo
- Tax year
- 2022
- Living Area
- 846 sq ft.
- $/Sqft
- 591
- Living Area (M2)
- 78.5934
- Year Built
- 2005
- Tax Amount
- $
- Status
- Active
- Listing Type
- Highrise Condo
- Buiding
- One Miami
- Tower
- West
- Internet/Ethernet
- Yes
- Days On Website
- 5 months
- Pool
- Yes
- Pets Allowed
- Yes
- Parking Spots
- 1
- Valet Services
- Yes
Property Amenities
Interior Features
- First Floor Entry
- Fire Sprinklers
Exterior Features
- Open Balcony
Equipment
- Dishwasher
- Disposal
- Dryer
- Ice Maker
- Microwave
- Electric Range
- Refrigerator
- Washer
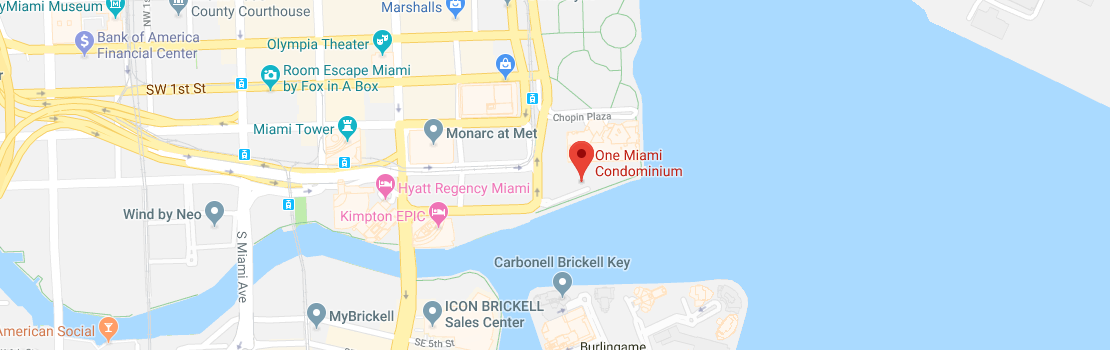
Map Location
Similar Units
| Address | Unit # | Price | %Chng | Bed/Bath | Square Feet | Square m2 | Maint/$ |
|---|---|---|---|---|---|---|---|
| 540 Brickell Key Dr #512 | 512 | $279,000 | 1/1 | 520 | 48 | $990 | |
| 540 Brickell Key Dr #210 | 210 | $299,000 | 1/1 | 600 | 56 | $700 | |
| 540 Brickell Key Dr #830 | 830 | $305,000 | 0/1 | 370 | 34 | $658 | |
| 520 Brickell Key Dr #A1617 | A1617 | $335,000 | 0/1 | 478 | 44 | $1,939 | |
| 325 S Biscayne Blvd #1520 | 1520 | $355,000 | 0/1 | 507 | 47 | $577 | |
| 325 S Biscayne Blvd #3320 | 3320 | $360,000 | 0/1 | 507 | 47 | $578 | |
| 540 Brickell Key Dr #1224 | 1224 | $365,000 | 1/1 | 640 | 59 | $887 | |
| 540 Brickell Key Dr #1600 | 1600 | $375,000 | 1/1 | 700 | 65 | $549 | |
| 540 Brickell Key Dr #300 | 300 | $380,000 | 1/1 | 630 | 59 | $754 | |
| 227 NE 2nd St #1508 | 1508 | $390,000 | 0/1 | 393 | 37 | $539 | |
| 227 NE 2nd St #2107 | 2107 | $390,000 | 0/1 | 386 | 36 | $609 | |
| 540 Brickell Key Dr #620 | 620 | $397,000 | 1/1 | 700 | 65 | $1,032 | |
| 227 NE 2nd St #1507 | 1507 | $397,000 | 0/1 | 386 | 36 | $609 | |
| 227 NE 2nd St #2113 | 2113 | $399,000 | 0/1 | 420 | 39 | $576 | |
| 540 Brickell Key Dr #900 | 900 | $399,000 | 1/1 | 700 | 65 | $1,031 |
onemiamidowntown.com is not responsible for the accuracy of the information listed above. The data relating to real estate for sale on this web site comes in part from the Internet Data Exchange Program and the South East Florida Regional MLS and is provided here for consumers personal, non-commercial use, It may not be used for any purpose other than to identify prospective properties consumers may be interested in purchasing. Real Estate listings held by brokerage firms other than the office owning this web site are marked with the IDX logo. Data provided is deemed reliable but not guaranteed. Listing provided by Cervera Real Estate Inc.