 English


441 Collins Ave #4
Miami Beach FL 33139
$198,000
Affordability
Monthly Mortgage for Unit 4
$198,000$39,600 20%
30 Year Fixed at 6.75% Adjust
$1,018/month
Property Description
Live in the heart of South of Fifth, just 2 blocks from the beach. This charming first-floor studio offers the rare convenience of assigned parking in one of Miami Beach’s most walkable and desirable neighborhoods. Tucked inside the boutique Southern Star Condo, this residence combines vintage charm with unbeatable location—steps from South Pointe Park, world-class dining, and the vibrant energy of Ocean Drive. Perfect for a beachside pied-à-terre, investment, or full-time living. (Unit 6 is also available for sale by the same owner)
Property Details
- Unit #
- 4
- Bedrooms
- 0
- Bathrooms
- 1
- Maintenance Fee
- $1,600/mo
- Tax year
- 2024
- Living Area
- 420 sq ft.
- $/Sqft
- 471
- Living Area (M2)
- 39.018
- Year Built
- 2005
- Tax Amount
- $
- Status
- Active
- Listing Type
- Highrise Condo
- Buiding
- One Miami
- Tower
- West
- Internet/Ethernet
- Yes
- Days On Website
- 1 week
- Pool
- Yes
- Pets Allowed
- Yes
- Parking Spots
- 0
- Valet Services
- Yes
Property Amenities
Interior Features
- First Floor Entry
Exterior Features
- None
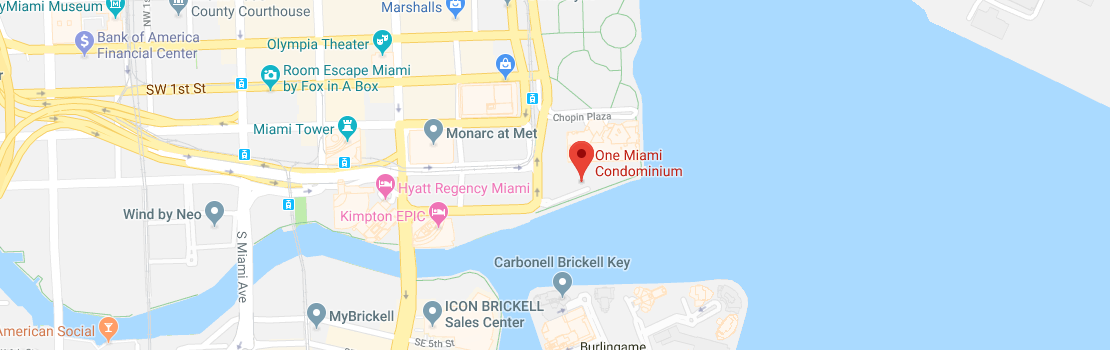
Map Location
Similar Units
| Address | Unit # | Price | %Chng | Bed/Bath | Square Feet | Square m2 | Maint/$ |
|---|---|---|---|---|---|---|---|
| 432 TILFORD T #432 | 432 | $90,000 | 1/1 | 585 | 54 | $552 | |
| 67 Harwood H #67 | 67 | $110,000 | 1/1 | 585 | 54 | $517 | |
| 642 Michigan Ave #14 | 14 | $149,000 | 0/1 | 285 | 26 | $604 | |
| 284 Prescott N #284 | 284 | $155,000 | 1/1 | 700 | 65 | $500 | |
| 763 Pennsylvania Ave #101 | 101 | $165,000 | 0/1 | 305 | 28 | $935 | |
| 544 Michigan Ave #9 | 9 | $175,000 | 0/1 | 0 | 0 | $540 | |
| 0 #8 | 8 | $180,000 | 0/1 | 300 | 28 | $1,114 | |
| 1228 Pennsylvania Ave #3 | 3 | $185,000 | 0/1 | 400 | 37 | $320 | |
| 1228 Pennsylvania Ave #2 | 2 | $185,000 | 0/1 | 400 | 37 | $320 | |
| 900 Jefferson Ave #2 | 2 | $185,000 | 0/1 | 440 | 41 | $678 | |
| 1050 Pennsylvania Ave #12-A | 12-A | $185,000 | 0/1 | 380 | 35 | $453 | |
| 763 Pennsylvania Ave #116 | 116 | $187,000 | 0/1 | 270 | 25 | $863 | |
| 763 Pennsylvania Ave #130 | 130 | $188,000 | 0/1 | 270 | 25 | $836 | |
| 653 Michigan Ave #4 | 4 | $190,000 | 0/1 | 450 | 42 | $357 | |
| 441 Collins Ave #4 | 4 | $198,000 | 0/1 | 420 | 39 | $1,600 |
Recent Similar Sales/Rentals
1 Bedroom Apartments Recent Sales
| Unit # | Closed Date | Sold Price | List Price | Bed | Bath | Living Area | Days on Market |
|---|---|---|---|---|---|---|---|
| 308 | 07/01/2025 | $280,000 | $299,000 | 1 | 1 | 730 | 3 months |
| B204 | 06/30/2025 | $270,000 | $309,000 | 1 | 1 | 447 | 4 months |
| 914 | 06/30/2025 | $470,000 | $495,000 | 1 | 1 | 656 | 4 months |
| 602 | 06/30/2025 | $375,000 | $405,000 | 1 | 1 | 659 | 3 months |
| 11 | 06/24/2025 | $245,000 | $269,000 | 1 | 1 | 731 | 5 months |
| TH-4M | 06/23/2025 | $1,440,000 | $1,599,000 | 1 | 1 | 1,310 | 1 month |
| 4 | 06/20/2025 | $190,000 | $210,000 | 1 | 1 | 585 | 10 months |
| 1405 | 06/18/2025 | $675,000 | $699,999 | 1 | 1 | 740 | 3 months |
| 33 | 06/17/2025 | $260,000 | $265,000 | 1 | 1 | 405 | 4 months |
| 2008 | 06/17/2025 | $935,000 | $1,100,000 | 1 | 1 | 851 | 6 months |
| 1124 | 06/16/2025 | $400,000 | $425,000 | 1 | 1 | 694 | 4 months |
| B105 | 06/16/2025 | $205,000 | $220,000 | 1 | 1 | 420 | 8 months |
| 706 | 06/16/2025 | $476,000 | $550,000 | 1 | 1 | 700 | 6 months |
| Number of Units | Avg Price | Avg $/SQFT | Lowest Sale Price | Highest Sale Price | Avg Days on Market |
|---|---|---|---|---|---|
| 13 | $478,538 | $710 | $190,000 | $1,440,000 | 159 |
2 Bedroom Apartments Recent Sales
| Unit # | Closed Date | Sold Price | List Price | Bed | Bath | Living Area | Days on Market |
|---|---|---|---|---|---|---|---|
| 304 | 06/30/2025 | $275,000 | $285,000 | 2 | 2 | 629 | 1 month |
| 204 | 06/27/2025 | $320,000 | $339,000 | 2 | 1 | 790 | 2 months |
| 125 | 06/20/2025 | $165,000 | $165,000 | 2 | 2 | 1,000 | 5 months |
| 3106 | 06/16/2025 | $1,850,000 | $1,995,000 | 2 | 2 | 1,452 | 11 months |
| Number of Units | Avg Price | Avg $/SQFT | Lowest Sale Price | Highest Sale Price | Avg Days on Market |
|---|---|---|---|---|---|
| 4 | $652,500 | $605 | $165,000 | $1,850,000 | 153 |
3 Bedroom Apartments Recent Sales
| Unit # | Closed Date | Sold Price | List Price | Bed | Bath | Living Area | Days on Market |
|---|---|---|---|---|---|---|---|
| 14020 | 06/27/2025 | $1,250,000 | $1,275,000 | 3 | 3 | 1,425 | 1 month |
| 1401 | 06/16/2025 | $1,650,000 | $1,945,000 | 3 | 3 | 1,991 | 4 months |
| Number of Units | Avg Price | Avg $/SQFT | Lowest Sale Price | Highest Sale Price | Avg Days on Market |
|---|---|---|---|---|---|
| 2 | $1,450,000 | $936 | $1,250,000 | $1,650,000 | 92 |
4 Bedroom Apartments Recent Sales
| Unit # | Closed Date | Sold Price | List Price | Bed | Bath | Living Area | Days on Market |
|---|---|---|---|---|---|---|---|
| 1404 | 06/18/2025 | $14,603,000 | $14,900,000 | 4 | 3 | 3,731 | 1 year |
| Number of Units | Avg Price | Avg $/SQFT | Lowest Sale Price | Highest Sale Price | Avg Days on Market |
|---|---|---|---|---|---|
| 1 | $14,603,000 | $3,994 | $14,603,000 | $14,603,000 | 637 |
onemiamidowntown.com is not responsible for the accuracy of the information listed above. The data relating to real estate for sale on this web site comes in part from the Internet Data Exchange Program and the South East Florida Regional MLS and is provided here for consumers personal, non-commercial use, It may not be used for any purpose other than to identify prospective properties consumers may be interested in purchasing. Real Estate listings held by brokerage firms other than the office owning this web site are marked with the IDX logo. Data provided is deemed reliable but not guaranteed. Listing provided by Compass Florida LLC