 English


Property Description
Located in the sought-after One Miami East Tower, this bayfront 1BR/1BA sits on the building’s premier one-bedroom line, offering stunning panoramic Biscayne Bay views and a front-row seat to Miami’s July 4th and New Year’s Eve fireworks. Features white oak built-ins in both the living room and bedroom. Prime Downtown Miami location near Brickell, Bayfront Park, Whole Foods, Kaseya Center, dining, shopping, and beaches. Cable and internet included. Luxury amenities include two resort-style pools, hot tubs, two fitness centers, party and conference rooms, 24-hour concierge and security, valet parking, and an on-site market. Ideal for full-time living, a vacation retreat, or an investment property.
Property Details
- Unit #
- 2702 (floorplan)
- Bedrooms
- 1
- Bathrooms
- 1
- Maintenance Fee
- $880/mo
- Tax year
- 2025
- Living Area
- 846 sq ft.
- $/Sqft
- 508
- Living Area (M2)
- 78.5934
- Year Built
- 2005
- Tax Amount
- $
- Status
- Active
- Listing Type
- Highrise Condo
- Buiding
- One Miami
- Tower
- East
- Internet/Ethernet
- Yes
- Days On Website
- 1 month
- Pool
- Yes
- Pets Allowed
- Yes
- Parking Spots
- 1
- Valet Services
- Yes
Property Amenities
Interior Features
- Built-in Features
- Closet Cabinetry
Exterior Features
- East Of Us1
- Other
- Open Balcony
Equipment
- Dishwasher
- Disposal
- Dryer
- Microwave
- Electric Range
- Refrigerator
- Washer
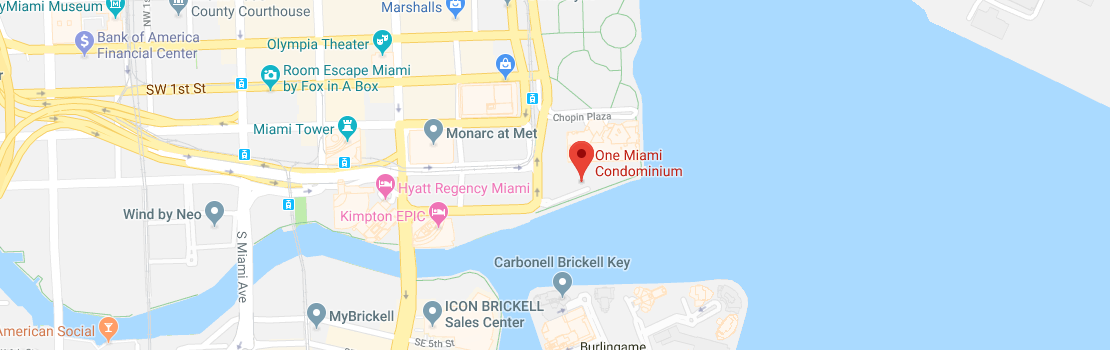
Map Location
Similar Units
| Address | Unit # | Price | %Chng | Bed/Bath | Square Feet | Square m2 | Maint/$ |
|---|---|---|---|---|---|---|---|
| 540 Brickell Key Dr #210 | 210 | $285,000 | 1/1 | 600 | 56 | $783 | |
| 540 Brickell Key Dr #414 | 414 | $295,000 | 1/1 | 640 | 59 | $862 | |
| 540 Brickell Key Dr #928 | 928 | $320,000 | 0/1 | 370 | 34 | $611 | |
| 540 Brickell Key Dr #412 | 412 | $329,900 | 1/1 | 700 | 65 | $1,817 | |
| 540 Brickell Key Dr #409 | 409 | $340,000 | 0/1 | 540 | 50 | $600 | |
| 540 Brickell Key Dr #705 | 705 | $349,000 | 1/1 | 700 | 65 | $963 | |
| 520 Brickell Key Dr #A1912 | A1912 | $349,500 | 1/1 | 836 | 78 | $1,141 | |
| 540 Brickell Key Dr #202 | 202 | $360,000 | 1/1 | 770 | 72 | $1,155 | |
| 227 NE 2nd St #2911 | 2911 | $365,000 | 0/1 | 446 | 41 | $650 | |
| 227 NE 2nd St #2412 | 2412 | $367,000 | 0/1 | 446 | 41 | $639 | |
| 540 Brickell Key Dr #818 | 818 | $375,000 | 1/1 | 720 | 67 | $1,066 | |
| 335 S Biscayne Blvd #1006 | 1006 | $380,000 | 0/1 | 507 | 47 | $531 | |
| 540 Brickell Key Dr #1524 | 1524 | $385,000 | 1/1 | 640 | 59 | $821 | |
| 540 Brickell Key Dr #925 | 925 | $387,500 | 1/1 | 640 | 59 | $820 | |
| 227 NE 2nd St #1707 | 1707 | $389,000 | 0/1 | 386 | 36 | $635 |
Recent Similar Sales/Rentals
Studios Bedroom Apartments Recent Sales
| Unit # | Closed Date | Sold Price | List Price | Bed | Bath | Living Area | Days on Market |
|---|---|---|---|---|---|---|---|
| 343 | 03/02/2026 | $230,000 | $255,000 | 0 | 1 | 580 | 2 months |
| Number of Units | Avg Price | Avg $/SQFT | Lowest Sale Price | Highest Sale Price | Avg Days on Market |
|---|---|---|---|---|---|
| 1 | $230,000 | $440 | $230,000 | $230,000 | 86 |
1 Bedroom Apartments Recent Sales
| Unit # | Closed Date | Sold Price | List Price | Bed | Bath | Living Area | Days on Market |
|---|---|---|---|---|---|---|---|
| 1805 | 04/10/2026 | $400,000 | $429,000 | 1 | 1 | 516 | 1 year |
| 1602 | 02/25/2026 | $377,500 | $385,000 | 1 | 1 | 700 | 4 months |
| 728 | 02/23/2026 | $338,000 | $370,000 | 1 | 1 | 700 | 1 year |
| 1813 | 02/20/2026 | $330,000 | $389,900 | 1 | 1 | 690 | 3 months |
| 2602 | 02/17/2026 | $700,000 | $760,000 | 1 | 1 | 1,076 | 8 months |
| 2704 | 02/12/2026 | $375,000 | $418,000 | 1 | 1 | 846 | 5 months |
| 4005 | 02/06/2026 | $620,000 | $665,000 | 1 | 1 | 950 | 2 months |
| Number of Units | Avg Price | Avg $/SQFT | Lowest Sale Price | Highest Sale Price | Avg Days on Market |
|---|---|---|---|---|---|
| 7 | $448,643 | $625 | $330,000 | $700,000 | 217 |
2 Bedroom Apartments Recent Sales
| Unit # | Closed Date | Sold Price | List Price | Bed | Bath | Living Area | Days on Market |
|---|---|---|---|---|---|---|---|
| 4507W | 04/08/2026 | $2,250,000 | $2,500,000 | 2 | 3 | 1,871 | 2 months |
| 3108 | 02/27/2026 | $1,075,000 | $1,200,000 | 2 | 2 | 1,500 | 2 months |
| 4603 | 02/27/2026 | $1,100,000 | $1,225,000 | 2 | 2 | 1,492 | 7 months |
| 1521 | 02/19/2026 | $621,000 | $635,000 | 2 | 2 | 1,227 | 8 months |
| 505 | 02/13/2026 | $1,125,000 | $1,325,000 | 2 | 2 | 1,579 | 4 months |
| Number of Units | Avg Price | Avg $/SQFT | Lowest Sale Price | Highest Sale Price | Avg Days on Market |
|---|---|---|---|---|---|
| 5 | $1,234,200 | $863 | $621,000 | $2,250,000 | 157 |
3 Bedroom Apartments Recent Sales
| Unit # | Closed Date | Sold Price | List Price | Bed | Bath | Living Area | Days on Market |
|---|---|---|---|---|---|---|---|
| 3612 | 03/06/2026 | $875,000 | $935,000 | 3 | 2 | 1,416 | 1 year |
| 3723 | 03/03/2026 | $1,120,000 | $1,189,000 | 3 | 2 | 1,792 | 1 month |
| 3902 | 02/27/2026 | $3,110,000 | $3,500,000 | 3 | 3 | 2,442 | 8 months |
| A604 | 02/26/2026 | $750,000 | $799,000 | 3 | 3 | 1,624 | 2 months |
| 2703 | 01/31/2026 | $3,780,000 | $3,999,000 | 3 | 4 | 3,075 | 4 weeks |
| Number of Units | Avg Price | Avg $/SQFT | Lowest Sale Price | Highest Sale Price | Avg Days on Market |
|---|---|---|---|---|---|
| 5 | $1,927,000 | $910 | $750,000 | $3,780,000 | 166 |
4 Bedroom Apartments Recent Sales
| Unit # | Closed Date | Sold Price | List Price | Bed | Bath | Living Area | Days on Market |
|---|---|---|---|---|---|---|---|
| PH5402 | 02/26/2026 | $4,190,500 | $4,975,000 | 4 | 5 | 4,310 | 5 months |
| 5201E | 02/06/2026 | $6,500,000 | $7,800,000 | 4 | 5 | 3,235 | 2 months |
| Number of Units | Avg Price | Avg $/SQFT | Lowest Sale Price | Highest Sale Price | Avg Days on Market |
|---|---|---|---|---|---|
| 2 | $5,345,250 | $1,783 | $4,190,500 | $6,500,000 | 132 |
onemiamidowntown.com is not responsible for the accuracy of the information listed above. The data relating to real estate for sale on this web site comes in part from the Internet Data Exchange Program and the South East Florida Regional MLS and is provided here for consumers personal, non-commercial use, It may not be used for any purpose other than to identify prospective properties consumers may be interested in purchasing. Real Estate listings held by brokerage firms other than the office owning this web site are marked with the IDX logo. Data provided is deemed reliable but not guaranteed. Listing provided by Imperial Home Realty, LLC.