 English


Property Description
Come see this perfectly positioned 1/1 located where the Miami River meets Biscayne Bay. Breathtaking city and water views combined with world-class amenities located in the vibrant and exciting heart of Downtown Miami make this building the place to be. Amenities include 24-hour concierge service, security, valet, garage parking, 2 pools and a jacuzzi, 2 gyms, his and hers saunas, 2 party rooms, a well-stocked lobby convenience store, a business center, and EV charging. The Miami Riverwalk Promenade, Miami Metromover, Bayfront Park, Bayside Marketplace, Kaseya Center, Whole Foods, Gordon Ramsay’s Hell’s Kitchen, Silverspot Cinema, Starbucks, area museums, restaurants, bars, and shopping destinations are all a short walk away.
Property Details
- Unit #
- 2118 (floorplan)
- Bedrooms
- 1
- Bathrooms
- 1
- Maintenance Fee
- $958/mo
- Tax year
- 2023
- Living Area
- 846 sq ft.
- $/Sqft
- 572
- Living Area (M2)
- 78.5934
- Year Built
- 2005
- Tax Amount
- $
- Status
- Active
- Listing Type
- Highrise Condo
- Buiding
- One Miami
- Tower
- West
- Internet/Ethernet
- Yes
- Days On Website
- 1 year
- Pool
- Yes
- Pets Allowed
- Yes
- Parking Spots
- 1
- Valet Services
- Yes
Property Amenities
Interior Features
- Elevator
- Fire Sprinklers
- Walk-In Closet(s)
- No Additional Rooms
Exterior Features
- Other
Equipment
- Dishwasher
- Disposal
- Dryer
- Ice Maker
- Microwave
- Electric Range
- Refrigerator
- Self Cleaning Oven
- Washer
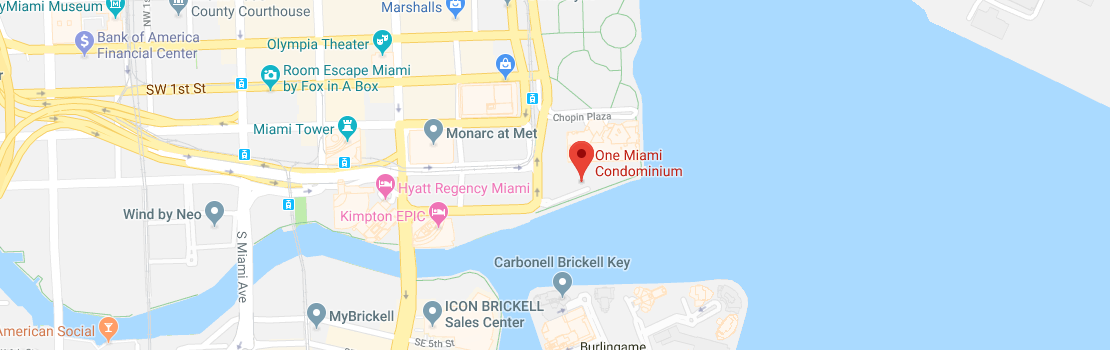
Map Location
Similar Units
| Address | Unit # | Price | %Chng | Bed/Bath | Square Feet | Square m2 | Maint/$ |
|---|---|---|---|---|---|---|---|
| 825 Brickell Bay Dr #343 | 343 | $255,000 | 0/1 | 580 | 54 | $553 | |
| 540 Brickell Key Dr #210 | 210 | $285,000 | 1/1 | 600 | 56 | $783 | |
| 540 Brickell Key Dr #414 | 414 | $299,900 | 1/1 | 640 | 59 | $862 | |
| 540 Brickell Key Dr #302 | 302 | $315,000 | 1/1 | 780 | 72 | $1,154 | |
| 540 Brickell Key Dr #412 | 412 | $329,900 | 1/1 | 700 | 65 | $1,817 | |
| 540 Brickell Key Dr #1603 | 1603 | $339,000 | 1/1 | 600 | 56 | $856 | |
| 540 Brickell Key Dr #409 | 409 | $340,000 | 0/1 | 540 | 50 | $600 | |
| 540 Brickell Key Dr #705 | 705 | $349,000 | 1/1 | 700 | 65 | $963 | |
| 520 Brickell Key Dr #A1912 | A1912 | $349,500 | 1/1 | 836 | 78 | $1,141 | |
| 520 Brickell Key Dr #A1812 | A1812 | $365,000 | 1/1 | 836 | 78 | $747 | |
| 227 NE 2nd St #2412 | 2412 | $370,000 | 0/1 | 446 | 41 | $677 | |
| 540 Brickell Key Dr #818 | 818 | $375,000 | 1/1 | 720 | 67 | $1,066 | |
| 335 S Biscayne Blvd #1006 | 1006 | $380,000 | 0/1 | 507 | 47 | $531 | |
| 540 Brickell Key Dr #202 | 202 | $380,000 | 1/1 | 770 | 72 | $1,155 | |
| 540 Brickell Key Dr #1524 | 1524 | $385,000 | 1/1 | 640 | 59 | $821 |
Recent Similar Sales/Rentals
Studios Bedroom Apartments Recent Sales
| Unit # | Closed Date | Sold Price | List Price | Bed | Bath | Living Area | Days on Market |
|---|---|---|---|---|---|---|---|
| A1817 | 01/07/2026 | $255,000 | $285,000 | 0 | 1 | 478 | 6 months |
| Number of Units | Avg Price | Avg $/SQFT | Lowest Sale Price | Highest Sale Price | Avg Days on Market |
|---|---|---|---|---|---|
| 1 | $255,000 | $596 | $255,000 | $255,000 | 196 |
1 Bedroom Apartments Recent Sales
| Unit # | Closed Date | Sold Price | List Price | Bed | Bath | Living Area | Days on Market |
|---|---|---|---|---|---|---|---|
| 1602 | 02/25/2026 | $377,500 | $385,000 | 1 | 1 | 700 | 4 months |
| 2604 | 01/16/2026 | $415,000 | $425,000 | 1 | 1 | 846 | 2 months |
| 2705 | 01/09/2026 | $530,000 | $549,000 | 1 | 1 | 878 | 5 months |
| 2000 | 12/19/2025 | $445,000 | $450,000 | 1 | 1 | 597 | 5 months |
| 1703 | 12/18/2025 | $408,000 | $425,000 | 1 | 1 | 521 | 1 month |
| 1904 | 12/10/2025 | $365,000 | $399,999 | 1 | 1 | 846 | 7 months |
| 1709 | 12/09/2025 | $395,000 | $400,000 | 1 | 1 | 549 | 2 months |
| 1918 | 12/05/2025 | $455,000 | $499,999 | 1 | 1 | 846 | 3 months |
| 2702 | 12/04/2025 | $650,000 | $729,000 | 1 | 1 | 1,076 | 3 months |
| Number of Units | Avg Price | Avg $/SQFT | Lowest Sale Price | Highest Sale Price | Avg Days on Market |
|---|---|---|---|---|---|
| 9 | $448,944 | $635 | $365,000 | $650,000 | 121 |
2 Bedroom Apartments Recent Sales
| Unit # | Closed Date | Sold Price | List Price | Bed | Bath | Living Area | Days on Market |
|---|---|---|---|---|---|---|---|
| 3601 | 01/23/2026 | $980,000 | $1,050,000 | 2 | 2 | 1,539 | 4 months |
| 3211 | 01/20/2026 | $1,000,000 | $1,050,000 | 2 | 2 | 1,397 | 2 months |
| 3205 | 01/16/2026 | $1,120,000 | $1,168,000 | 2 | 2 | 1,540 | 4 months |
| 4115 | 01/15/2026 | $570,000 | $610,000 | 2 | 2 | 1,145 | 3 months |
| 4105 | 01/06/2026 | $685,000 | $695,000 | 2 | 2 | 1,227 | 1 month |
| 3907 | 12/22/2025 | $1,220,000 | $1,300,000 | 2 | 2 | 1,500 | 1 month |
| 5104 | 12/10/2025 | $1,280,000 | $1,500,000 | 2 | 2 | 1,492 | 2 months |
| Number of Units | Avg Price | Avg $/SQFT | Lowest Sale Price | Highest Sale Price | Avg Days on Market |
|---|---|---|---|---|---|
| 7 | $979,286 | $738 | $570,000 | $1,280,000 | 87 |
3 Bedroom Apartments Recent Sales
| Unit # | Closed Date | Sold Price | List Price | Bed | Bath | Living Area | Days on Market |
|---|---|---|---|---|---|---|---|
| 3902 | 02/27/2026 | $3,110,000 | $3,500,000 | 3 | 3 | 2,442 | 8 months |
| 4007 | 12/16/2025 | $2,450,000 | $2,750,000 | 3 | 2 | 2,126 | 4 months |
| Number of Units | Avg Price | Avg $/SQFT | Lowest Sale Price | Highest Sale Price | Avg Days on Market |
|---|---|---|---|---|---|
| 2 | $2,780,000 | $1,363 | $2,450,000 | $3,110,000 | 191 |
4 Bedroom Apartments Recent Sales
| Unit # | Closed Date | Sold Price | List Price | Bed | Bath | Living Area | Days on Market |
|---|---|---|---|---|---|---|---|
| PH5402 | 02/26/2026 | $4,190,500 | $4,975,000 | 4 | 5 | 4,310 | 5 months |
| Number of Units | Avg Price | Avg $/SQFT | Lowest Sale Price | Highest Sale Price | Avg Days on Market |
|---|---|---|---|---|---|
| 1 | $4,190,500 | $1,154 | $4,190,500 | $4,190,500 | 174 |
onemiamidowntown.com is not responsible for the accuracy of the information listed above. The data relating to real estate for sale on this web site comes in part from the Internet Data Exchange Program and the South East Florida Regional MLS and is provided here for consumers personal, non-commercial use, It may not be used for any purpose other than to identify prospective properties consumers may be interested in purchasing. Real Estate listings held by brokerage firms other than the office owning this web site are marked with the IDX logo. Data provided is deemed reliable but not guaranteed. Listing provided by Beycome of Florida LLC